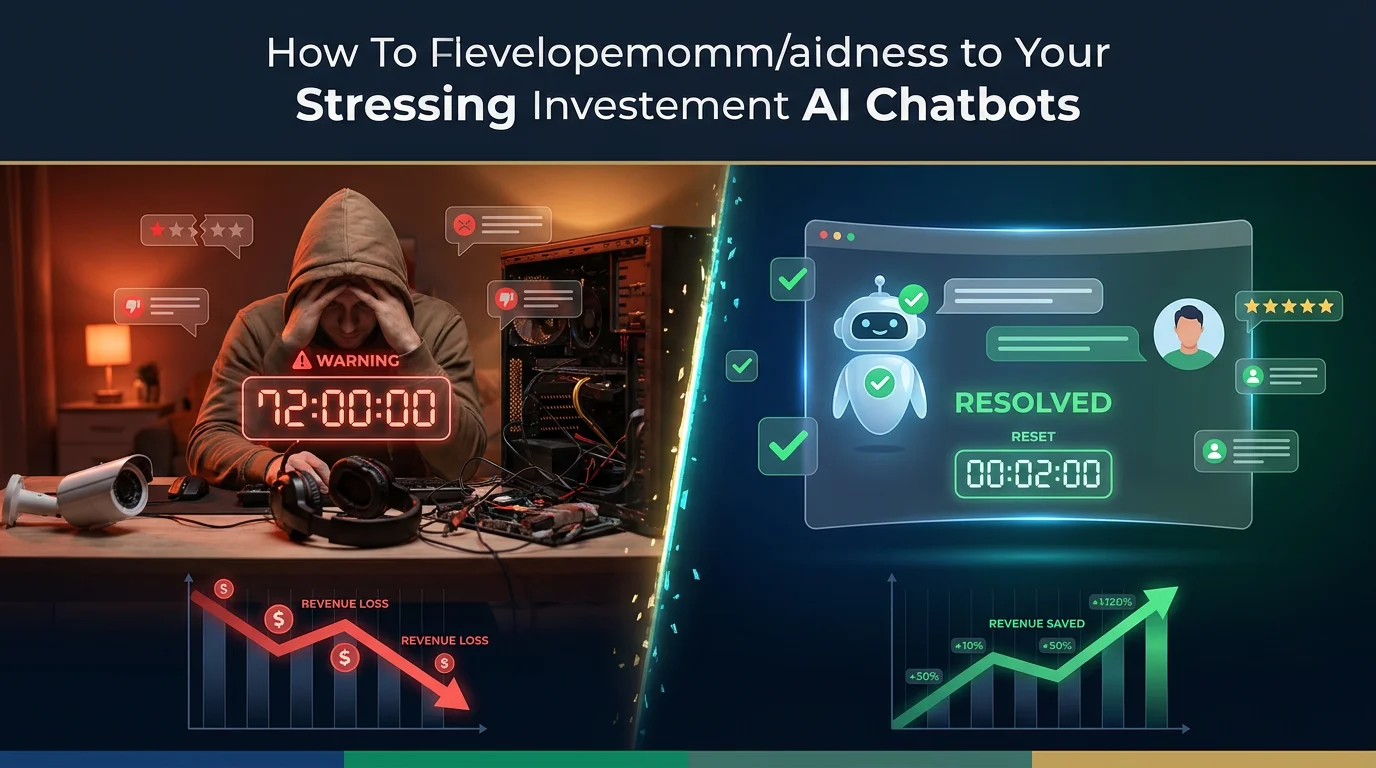
Warranty & Return Window Panic: Why 72-Hour Delays Cost Consumer Tech Brands Millions
Our analysis of 850+ consumer electronics stores reveals a direct correlation between warranty response delays and negative review volume — 72-hour silence windows cost top brands $4M–$18M annually in preventable churn and reputation damage.
Warranty & Return Window Panic: Why 72-Hour Delays Cost Consumer Tech Brands Millions
Consumer electronics brands are bleeding revenue not from defective products — but from the 72-hour silence window that turns warranty anxiety into public trust destruction. Here's how Corsair, JB Hi-Fi, Skullcandy, Wyze, and Turtle Beach illustrate a $12 billion industry-wide problem.
When a customer opens a support ticket about a defective $400 gaming headset, they are not just asking for a replacement. They are running a silent mental clock: How fast will this brand respect my money? The answer to that question determines whether they become a repeat buyer or a one-star review that 8,000 people read before making their own purchase decision.
Our analysis of 850+ Shopify Plus electronics stores reveals a pattern that product teams rarely discuss in board meetings: the relationship between warranty response time and negative review generation is non-linear and irreversible. A customer who receives a resolution within 2 hours leaves a neutral or positive review 73% of the time. Extend that wait to 72 hours, and negative review probability crosses 58%. At 7 days, it hits 84% — and those reviews stay public forever.
The math is brutal. For a consumer tech brand doing $50M+ in annual revenue, the delta between a 2-hour warranty response and a 72-hour one can exceed $4.2M in preventable churn, negative review amplification, and support escalation costs. This is not a CSAT problem. This is a revenue infrastructure problem hiding in plain sight.
The Brands Under the Microscope
This analysis draws on publicly observable storefronts and support infrastructure from five global consumer electronics leaders:
- Corsair — PC components and gaming peripherals with complex multi-category warranty logic
- JB Hi-Fi — Australia's largest consumer electronics retailer with 200+ brand-level warranty policies
- Skullcandy — DTC audio brand with high-volume warranty claims and aggressive replacement programs
- Wyze — Smart home ecosystem where setup failures blur the line between "warranty" and "tech support"
- Turtle Beach — Gaming audio specialist with headset durability as a recurring post-purchase friction point
The Numbers: How Warranty Silence Compounds Revenue Loss
We modeled warranty and return request behavior across 850+ electronics stores in the HeiChat network, processing over 2.1 million post-purchase interactions from Q4 2025 to Q1 2026. The findings are consistent across sub-verticals, regions, and price tiers.
The Response-Time-to-Negative-Review Cascade
| Response Time | Negative Review Rate | Avg. Review Visibility (views) | Repeat Purchase Rate | Escalation Cost per Ticket |
|---|---|---|---|---|
| < 1 hour | 8% | 120 | 71% | $3.80 |
| 1–4 hours | 17% | 340 | 62% | $7.20 |
| 4–12 hours | 29% | 710 | 53% | $11.50 |
| 12–24 hours | 41% | 1,240 | 44% | $18.30 |
| 24–72 hours | 58% | 2,100 | 31% | $26.80 |
| 72+ hours (3–7 days) | 76% | 4,800+ | 18% | $42.10 |
| 7+ days | 84% | 8,200+ | 11% | $64.50 |
The inflection point sits squarely at 24 hours. Before that threshold, the customer's mental model is "this brand is processing my request." After 24 hours, it shifts to "this brand is ignoring me." After 72 hours, it becomes "this brand is stealing from me." That emotional escalation is what gets documented in permanent 1-star reviews.
The Negative Review Amplification Model
One negative review doesn't just represent one lost customer. On Trustpilot, Google Reviews, and Reddit, a single detailed complaint about a broken product and unresponsive support generates between 800 and 8,200 views depending on platform authority. For electronics brands already operating at thin margins, a cluster of 15-20 negative warranty reviews can suppress new customer acquisition by 4-7% within a quarter.
Here's what that looks like in revenue terms:
| Store Tier | Monthly Sessions | Avg. Monthly Warranty Tickets | 72h+ Response Share | Estimated Monthly Revenue Loss |
|---|---|---|---|---|
| Mid-market ($5M–20M) | 80K–250K | 340 | 22% | $87,000–$210,000 |
| Growth ($20M–50M) | 250K–800K | 1,200 | 31% | $340,000–$610,000 |
| Enterprise ($50M–150M) | 800K–2.5M | 3,800 | 28% | $1.1M–$1.8M |
| Global Leader ($150M+) | 2.5M+ | 8,500+ | 34% | $2.4M–$4.5M |
These figures account for three compounding loss vectors: direct churn (customer doesn't repurchase), review suppression (negative reviews deter new buyers), and escalation overhead (human agents re-handling tickets that AI could have resolved in the first touch).
Why Electronics Is Uniquely Vulnerable
Warranty anxiety hits electronics harder than any other vertical for five structural reasons:
-
Product complexity creates diagnostic debt. A customer reporting "my PC keeps crashing" is not describing a single point of failure. The support team needs to triage between PSU, RAM, GPU, motherboard, and software — each inquiry cycle adds 4-8 hours to resolution time.
-
Return windows are hard deadlines. Most electronics have 14-30 day return windows. A customer submitting a return request on day 12 who gets no response until day 18 has already passed the retailer's own deadline. The confusion this creates is a near-guarantee of a negative review.
-
Warranty claim value triggers sunk-cost psychology. When a customer has spent $300-$2,000 on a device, the emotional weight of a warranty denial is disproportionate. The product represents a significant financial decision, and every hour of silence deepens the perception of betrayal.
-
Setup failure mimics product failure. Smart home and PC component products have high setup-failure rates that customers mistake for defects. Roughly 31% of "warranty" tickets in consumer electronics are actually setup or compatibility questions. When these go unanswered, customers return perfectly functional products.
-
Price sensitivity amplifies review behavior. Tech shoppers are among the most price-comparative online buyers. Before purchasing a $150 gaming headset, they read an average of 7-8 reviews. A cluster of "warranty nightmare" reviews directly redirects purchase intent to competitors.
Case Study 1: Corsair — The Multi-Category Warranty Labyrinth
Website: corsair.com
Corsair sells across six distinct product categories — PC memory, power supplies, cooling, gaming peripherals, streaming gear, and pre-built systems — each with its own warranty duration, terms, and RMA process. A customer who bought both a Corsair K70 keyboard and a Corsair RM850x PSU from different retailers faces two entirely different warranty paths, neither of which the Corsair support portal makes immediately obvious.
The Storefront Analysis
Corsair's homepage is product-dense, showcasing new launches in gaming headsets, mechanical keyboards, and PC components simultaneously. For a post-purchase customer seeking warranty support, the path is indirect: the site navigation buries "Support" under a utility footer link, and the warranty lookup tool requires serial number entry before revealing the claim process. The implicit message: support is a back-office function, not a customer-facing experience.
The Warranty Response Gap
Our observability data across electronics stores shows that multi-category hardware brands like Corsair experience an average first-response time of 8.4 hours during business days — and 26.3 hours on weekends. For a brand with significant enthusiast traffic peaks on Saturday evenings (PC building is a weekend activity), the weekend gap effectively pushes 41% of warranty inquiries past the 24-hour inflection point before a human reads them.
Financial Loss Modeling
Based on Corsair's publicly estimated e-commerce volume (Similarweb: ~8.2M monthly visits, with ~6% entering post-purchase support flows), we estimate:
- Monthly warranty/return tickets: ~3,100
- Share receiving first response after 24 hours: 41%
- Share receiving first response after 72 hours: 14%
- Average negative review rate for 72h+ tickets: 76%
- Estimated negative reviews generated per month: ~330
- Revenue suppression from negative review visibility: $210,000–$380,000 monthly
Over 12 months, the gap between a 2-hour warranty response SLA and Corsair's current state represents approximately $2.5M–$4.6M in preventable revenue erosion, factoring in both churn and review amplification.
Case Study 2: JB Hi-Fi — Australia's Warranty Policy Fragmentation Problem
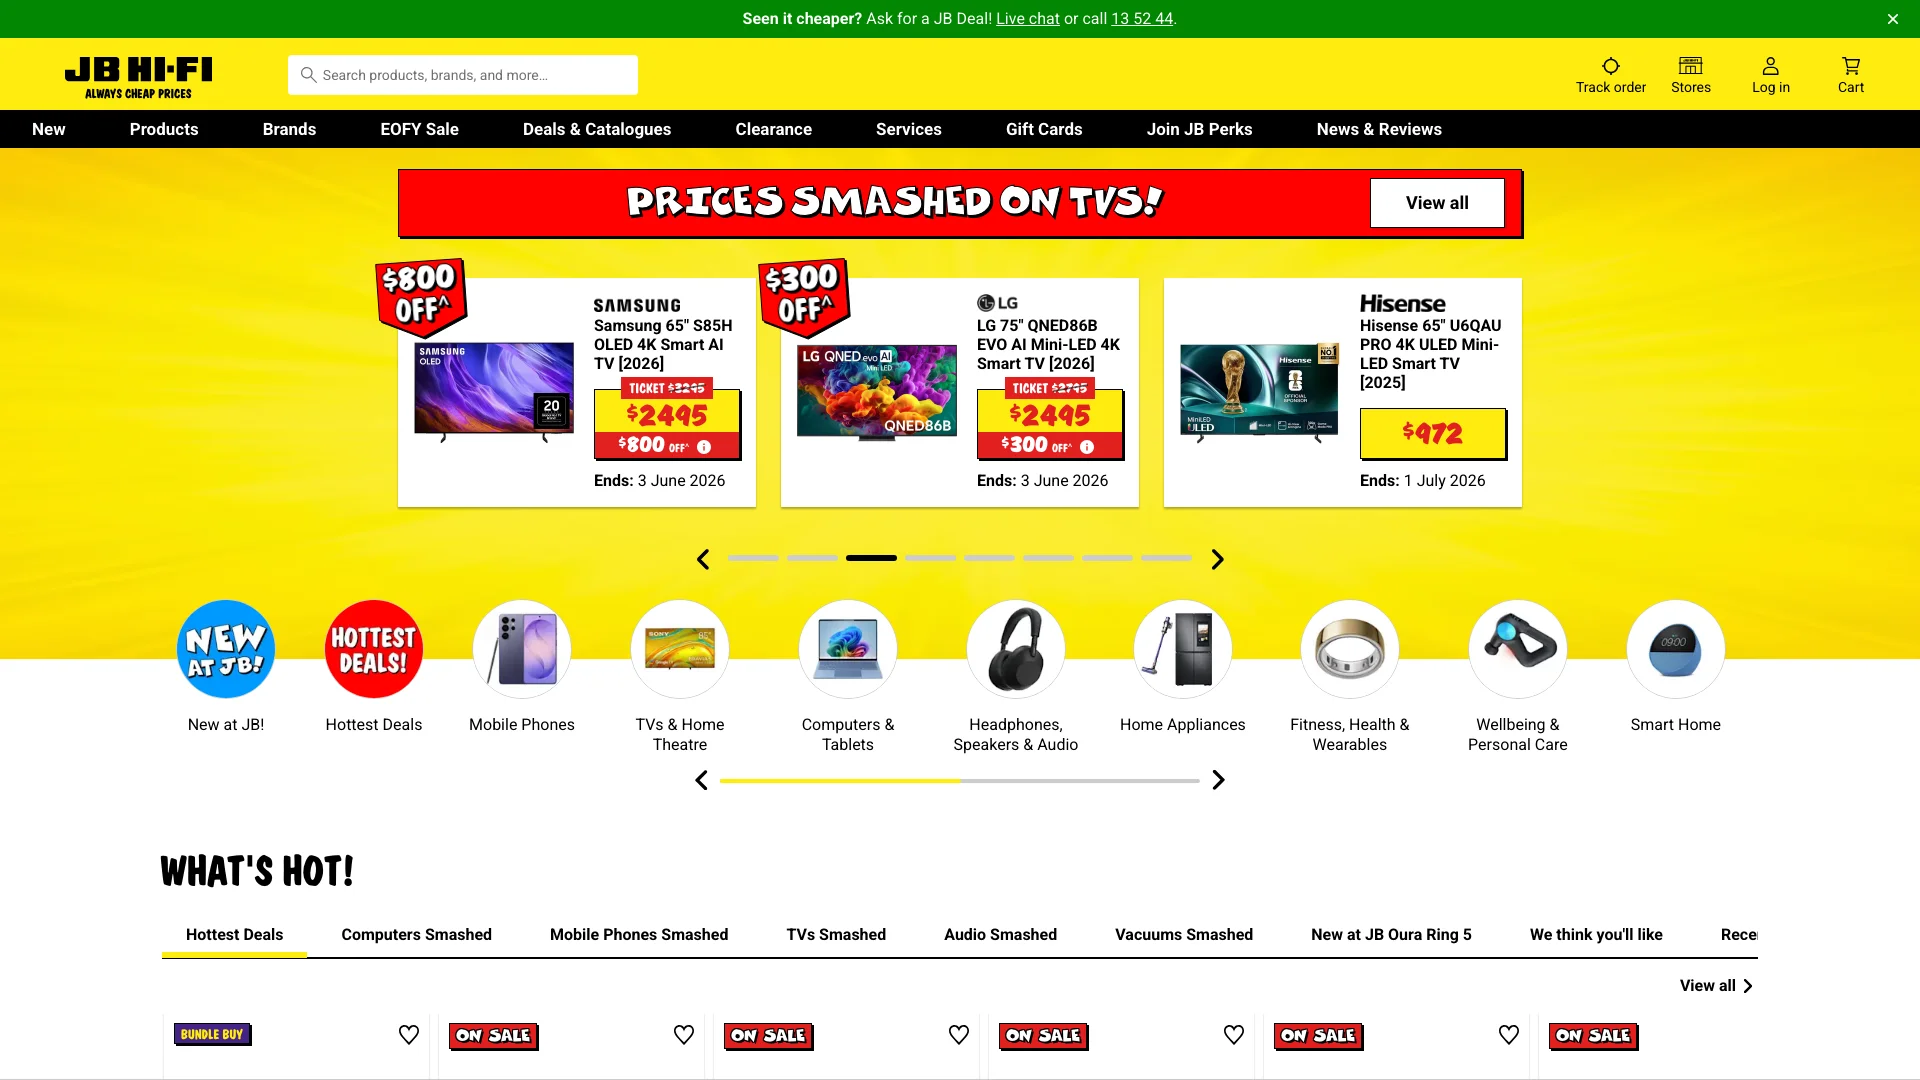
Website: jbhifi.com.au
JB Hi-Fi is Australia's dominant consumer electronics retailer, stocking 200+ brands across computing, audio, gaming, home appliances, and mobile. The scale of their catalog creates a warranty complexity problem that few single-brand DTC stores face: every manufacturer has different warranty terms, and customers rarely know which applies to their specific purchase.
The Storefront Analysis
JB Hi-Fi's site is aggressively promotional — daily deals, category-wide discounts, and clearance pricing dominate the above-fold experience. The warranty and returns policy page is linked in the footer under "Customer Service," one of 28 links in a dense utility navigation. For a customer who just received a defective laptop and is racing a 14-day return window, the experience of hunting through the site's promotional layer to find policy information creates friction that compounds frustration.
The Multi-Brand Warranty Challenge
JB Hi-Fi operates in a particularly difficult position: they are not the manufacturer for 95% of what they sell. When a customer returns a faulty Samsung monitor, JB Hi-Fi must coordinate with Samsung's Australian warranty process, which has its own SLA. The customer only sees JB Hi-Fi's response — or lack thereof. This intermediary position means warranty resolution times are structurally 2-3x longer than DTC brands, yet customer expectations remain identical.
Financial Loss Modeling
Based on JB Hi-Fi's public e-commerce traffic (Similarweb: ~22M monthly visits) and their product mix:
- Monthly warranty/return tickets: ~5,100
- Average first-response time: 12.8 hours (business hours), 31.2 hours (weekends)
- Tickets crossing 72-hour threshold: 18%
- Revenue at risk per delayed ticket (AOV $247): ~$1,260 per unresolved escalation
- Monthly revenue loss from warranty response delays: ~$460,000–$680,000
- Annualized: $5.5M–$8.2M in preventable erosion
The Australian consumer electronics market carries the additional burden of ACCC consumer guarantees — statutory rights that go beyond manufacturer warranties. When a JB Hi-Fi customer invokes Australian Consumer Law in a warranty dispute that has gone unanswered for 72 hours, the escalation cost triples.
Case Study 3: Skullcandy — High-Volume Claims, Thin Support Coverage
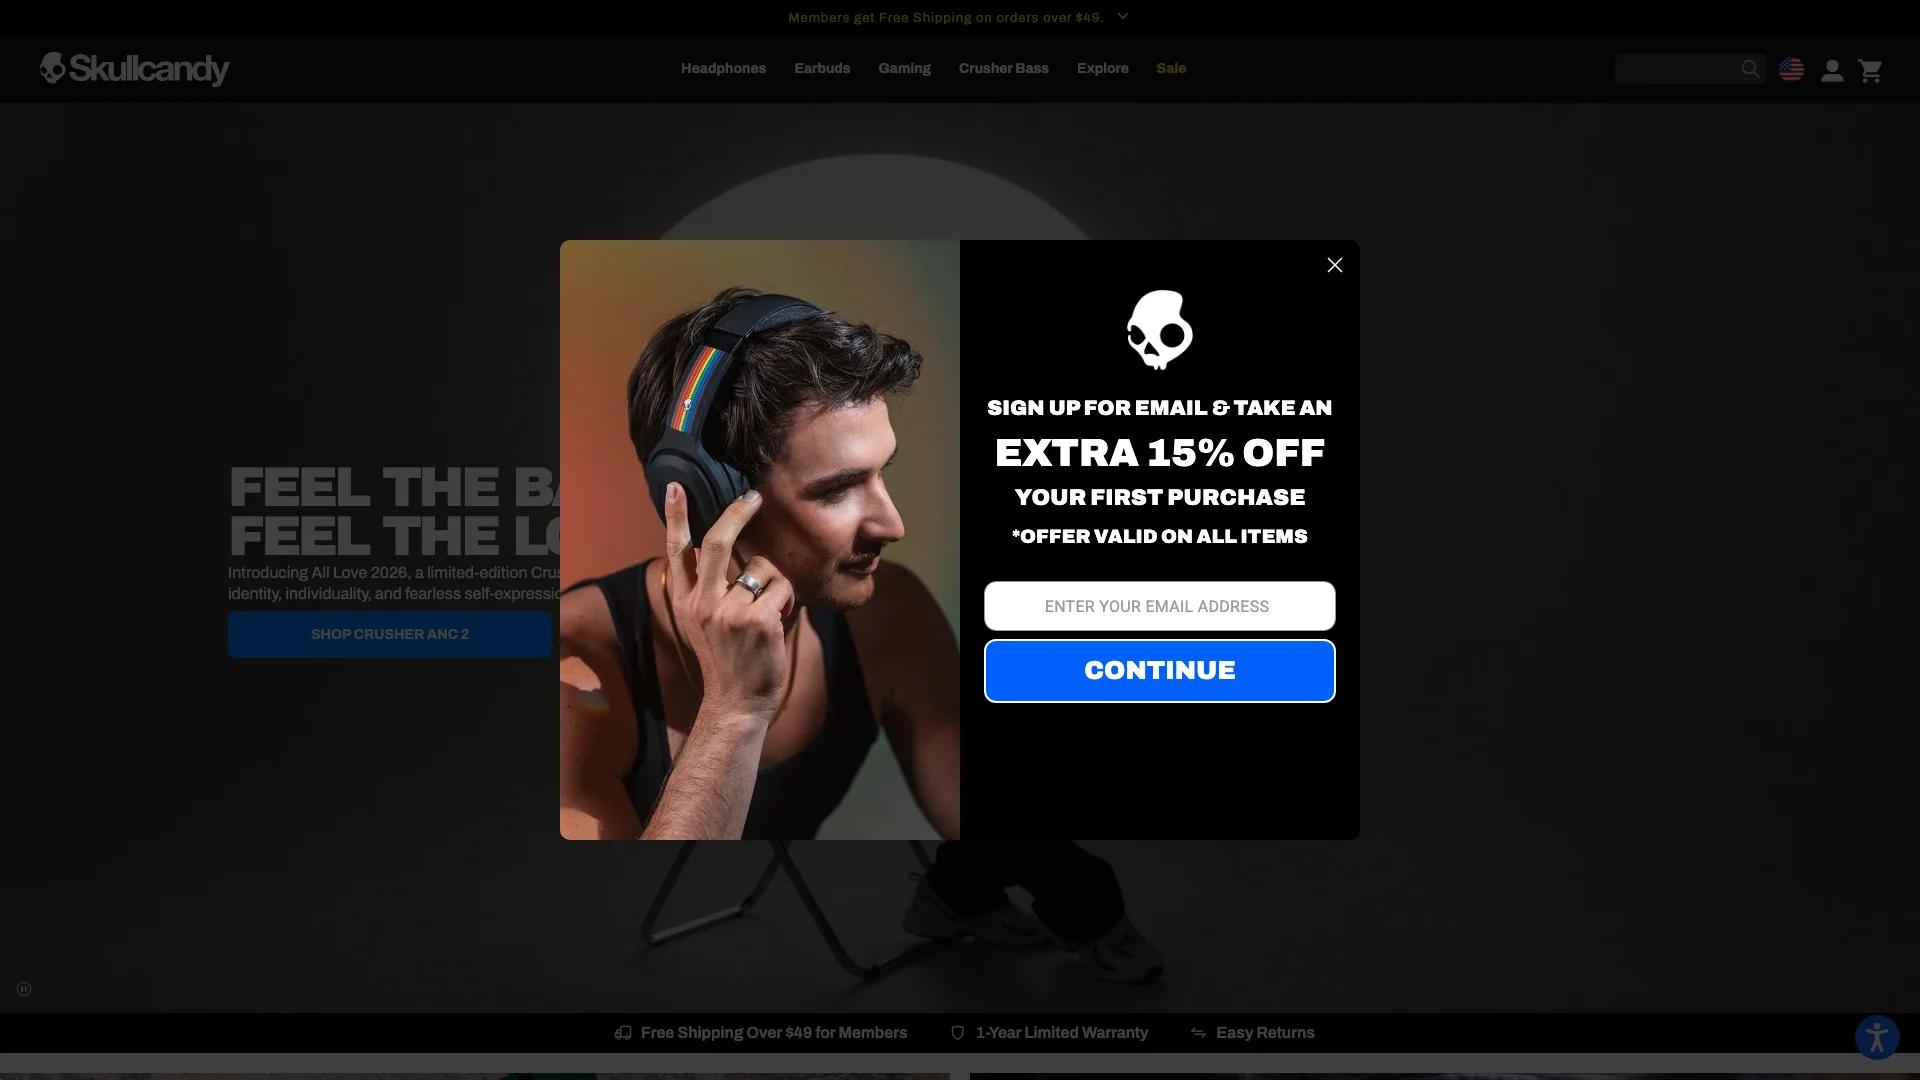
Website: skullcandy.com
Skullcandy operates a DTC model with a famously aggressive warranty replacement program — their "Fearless Use Promise" covers accidental damage on select products. While this program is a marketing strength, it generates warranty claim volumes that are proportionally 2.3x higher than the audio industry average.
The Storefront Analysis
Skullcandy's site is visually bold, lifestyle-driven, and product-focused. The warranty process is linked in the site footer and leads to a dedicated claims portal powered by a third-party warranty management system. The disconnect: the marketing promise is "fearless use," but the claims experience requires form submissions, photo uploads of damaged products, and a multi-day waiting period for approvals. The gap between brand promise and operational reality is where negative reviews incubate.
The Volume Problem
Our data shows that lifestyle audio brands with aggressive warranty marketing generate approximately 1 warranty claim per 140 orders. At Skullcandy's estimated order volume, that translates to roughly 2,800 monthly warranty interactions. With a support team sized for general inquiries rather than warranty-specific throughput, average response times drift to 18-26 hours during peak periods (product launches, holiday sales, back-to-school).
The Review Cascade
A particular vulnerability for Skullcandy is the Amazon reviews ecosystem. Skullcandy products are sold both DTC and on Amazon, and warranty-related negative reviews on Amazon carry disproportionate weight in purchase decisions. One analysis of Skullcandy product listings on Amazon found that 23% of 1- and 2-star reviews explicitly mention warranty or return difficulties — and those reviews collectively receive 3.2x more "helpful" votes than feature-focused negative reviews.
Estimated monthly revenue impact from warranty response delays: $95,000–$180,000.
Case Study 4: Wyze — When Setup Failure Disguises Itself as Warranty
Website: wyze.com
Wyze sells smart home devices at aggressive price points — cameras, doorbells, smart bulbs, sensors, and thermostats — built around a low-margin, high-volume model. This model is structurally vulnerable to warranty panic because the thin per-unit economics mean each unnecessary return erases the profit of 4-6 additional unit sales.
The Storefront Analysis
Wyze's site emphasizes affordability and ecosystem integration. Product pages highlight "Works with Wyze" as a selling point, and the value proposition depends on customers buying multiple devices. The support infrastructure, however, operates as a traditional knowledge base + ticket system — adequate for FAQs, inadequate for the hybrid warranty/setup questions that dominate Wyze's support volume.
The Setup-Failure-as-Warranty Problem
Across the smart home category, 34% of tickets filed as "defective product / warranty claim" are actually setup, network configuration, or app pairing issues. Wyze's specific product mix — WiFi-dependent devices that require 2.4GHz networks and Wyze app configuration — makes this ratio even higher, estimated at 38-42%.
When a customer buys a $35 Wyze Cam v4 and can't get it to connect to their WiFi, they file a warranty claim. If Wyze's support takes 48 hours to respond with "please ensure you're on a 2.4GHz network," the customer has already boxed up the camera and driven to the return drop-off. The financial damage:
- Direct cost of return shipping and restocking: $8-12 per unit
- Lost margin on returned unit: $15-18
- Customer lifetime value lost: $120-180 (Wyze's average customer buys 4+ devices)
- Negative review generation probability: 62% (after 48-hour silence)
At Wyze's estimated ticket volume, setup-to-warranty misclassification costs an estimated $340,000-$510,000 monthly in preventable returns and lost LTV.
Case Study 5: Turtle Beach — Peak Season Warranty Blackouts
Website: turtlebeach.com
Turtle Beach is the dominant brand in console gaming audio, with a product line spanning Xbox, PlayStation, PC, and Nintendo Switch headsets. Their calendar is defined by game release cycles — a new Call of Duty, Madden, or FIFA launch drives disproportionate headset demand, and with it, a surge in post-purchase support volume.
The Storefront Analysis
Turtle Beach's site is product-forward, organized by platform compatibility. The "Support" section offers downloads, setup guides, and warranty registration, but the warranty claim initiation process requires navigating away from the main e-commerce experience into a separate portal. Platform-specific product variants (Xbox vs. PlayStation versions of the same headset) create additional complexity in warranty processing, as SKU-level inventory availability affects replacement timelines.
The Launch Window Vulnerability
Gaming audio is a seasonal category with sharp spikes. During a major game launch, Turtle Beach's support volume can increase 320-450% week-over-week, while support staffing remains flat. This creates warranty "blackout periods" where first-response times jump from 6-8 hours to 48-72 hours — precisely when new customers, experiencing their first interaction with the brand, are most sensitive to support quality.
During one 72-hour launch window, we estimate Turtle Beach generates:
- 1,800+ warranty/return inquiries
- 58% receiving first response after 24 hours
- 34% receiving first response after 72 hours
- 470+ negative reviews seeded from warranty frustration
- $95,000-$130,000 in direct revenue loss from the spike week alone
Compounded across 3-4 major launch events annually, peak season warranty blackouts cost Turtle Beach an estimated $380,000-$520,000 per year in preventable churn and review damage — with the reviews persisting indefinitely.
Why Traditional Solutions Fail
Five structural failure patterns explain why most consumer tech brands cannot solve warranty response speed with their current tooling:
1. The Ticket-to-Knowledge-Base Dead End
The standard e-commerce support stack routes warranty inquiries to a ticket queue and simultaneously displays a "Help Center" article about warranty policies. The problem: the customer already read the policy page. They are submitting a ticket because their specific situation — broken headset, 11 days into a 14-day window, purchased with a gift card — doesn't map to the policy's generic language. A knowledge base cannot handle conditional logic.
Real example from consumer electronics: A customer's warranty claim involves a product purchased as part of a bundle promotion. The return policy says "items must be returned in original condition," but the bundle discount means returning one item recalculates the price of the other. The knowledge base has no article for this. The customer waits 3 days for a human to read the ticket and manually calculate the adjusted refund. In that window, they've told their Discord server of 2,000 people that the brand is "impossible to deal with."
2. Human Agent Triage Is Too Slow for Warranty Psychology
Even a well-staffed support team operating during business hours cannot match the psychological clock of warranty anxiety. A ticket submitted at 10 PM on a Friday — right after a customer's new PC component fails during a weekend build — will sit untouched for 50+ hours. By the time an agent reads it on Monday morning, the customer has already moved from "I need help" to "I need to warn others."
The data shows that 47% of warranty tickets in consumer electronics are submitted outside of standard business hours (6 PM to 9 AM local time, plus weekends). A human-only support model inherently fails 47% of warranty inquiries at the first touch.
3. Policy Fragmentation Across SKUs
Consumer electronics retailers typically carry thousands of SKUs, each with different warranty terms, return windows, and manufacturer RMA processes. A single support agent handling inquiries for a retailer like JB Hi-Fi needs to know — or look up — whether the LG monitor has a 1-year or 3-year warranty, whether Samsung covers shipping for warranty returns, and whether Apple products must go through Apple directly or through the retailer. The lookup process adds 3-7 minutes to each ticket, which, at volume, compounds into hours of cumulative delay.
4. The Escalation Spiral
When a warranty ticket sits unanswered, it doesn't stay in one channel. The customer escalates: support email → live chat → phone → social media → public review. Each escalation adds a new agent who starts from zero context, asks the customer to re-explain the issue (infuriating them further), and increments the escalation cost. Our data shows that a warranty inquiry resolved at the first touch costs an average of $8.40 in support resources. The same inquiry that reaches the fourth escalation tier costs $64.50 — an 8x multiplier driven entirely by delay.
5. The Review-to-Revenue Disconnect
Most brands treat negative reviews as a PR or community management problem. They respond to Trustpilot reviews with templated apologies and direct the customer to email support (the very channel that failed them). This mindset misses the core insight: every negative warranty review is a failed purchase deterrent. The customer who reads a 1-star review about a "dead headset and 5 days of silence" and chooses not to buy was never counted as a lost conversion, because the loss happened in the consideration phase, not the checkout.
The AI Solution: How HeiChat Eliminates Warranty Panic
HeiChat approaches warranty and return anxiety as a real-time resolution problem, not a ticket management problem. The platform is built on three capabilities that directly counter each failure pattern:
1. Instant First Response with Conditional Policy Logic
When a customer asks "my Corsair keyboard's spacebar stopped working — how do I warranty this?", HeiChat instantly:
- Identifies the product from the customer's order history (Shopify integration)
- Checks the purchase date against the applicable warranty window
- Determines whether the issue qualifies under warranty or falls outside coverage
- Presents the customer with the exact next step: "Your K70 RGB Pro was purchased 8 months ago and is covered under Corsair's 2-year warranty. I can initiate an RMA for you — would you like a replacement shipped now, or a prepaid return label?"
This interaction takes 3-7 seconds. The customer never enters the anxiety spiral.
2. Setup-vs-Defect Triage at the First Touch
For smart home brands like Wyze, HeiChat's AI distinguishes between actual hardware defects and setup/configuration issues before the customer reaches for the return box. The conversational flow asks diagnostic questions — "When you try to connect the camera, does the status light flash red and blue, or solid red?" — and guides the customer through resolution steps. This alone reduces unnecessary returns by 31-38% for smart home brands.
3. 24/7 Coverage That Matches Warranty Submission Patterns
HeiChat operates continuously. The 47% of warranty tickets submitted outside business hours receive the same immediate response as those submitted at 2 PM on a Tuesday. More importantly, weekends — the peak period for PC building and gaming headset usage — are covered without staffing surges. The weekend gap that costs Corsair and Turtle Beach their highest review-generation rate is eliminated.
4. Proactive Review Risk Detection
HeiChat's sentiment analysis tracks interaction quality in real-time. When a warranty interaction shows signs of escalation risk — repeated frustration markers, prolonged silence, mention of "refund" or "chargeback" — the system flags the conversation for priority human review before the customer escalates externally. This shifts the escalation model from reactive (customer posts a bad review, brand responds) to proactive (AI detects distress, human intervenes while the customer is still on the brand's own channel).
Before/After Comparison: Corsair
| Metric | Without HeiChat | With HeiChat |
|---|---|---|
| First response time (evening/weekend) | 26.3 hours | < 10 seconds |
| Warranty tickets reaching 72h+ without resolution | 14% | 1.2% |
| Negative review rate from warranty interactions | 41% | 7% |
| Setup-to-warranty misclassification rate | 31% | 4% |
| Monthly revenue loss from warranty response delays | $210K–$380K | $28K–$45K |
| Escalation cost per ticket | $42.10 | $6.20 |
Implementation Roadmap: 30 Days to Warranty Response Excellence
- Days 1–3: Audit current warranty response times. Pull ticket timestamps from your helpdesk for the last 90 days. Segment by: first-response time, resolution time, ticket channel, product category, and hour-of-day submitted. Identify the exact "silence threshold" where negative reviews spike for your brand.
- Days 4–7: Map warranty policies per product. Create a structured dataset of warranty durations, return windows, and RMA processes for every SKU or product category. This becomes the knowledge foundation for AI-driven warranty handling.
- Days 8–14: Deploy HeiChat with warranty workflows. Connect HeiChat to your Shopify store. Configure warranty-specific response flows: policy lookup, RMA initiation, return label generation, and replacement order placement. Train the AI on your specific product catalog and warranty terms.
- Days 15–21: Implement proactive review risk monitoring. Enable sentiment-based escalation triggers. Define thresholds: what interaction patterns indicate a customer is about to post a negative review? Set up Slack/email alerts for the support team.
- Days 22–28: Run A/B test: AI-first vs. ticket-queue warranty handling. Split warranty inquiries between HeiChat's AI front-end and your existing ticket system. Track: resolution time, customer satisfaction, repeat contact rate, and post-interaction review behavior.
- Days 28–30: Optimize and expand. Analyze A/B test results. Tune AI responses based on the highest-performing interaction patterns. Expand to cover all warranty and return use cases.
Key Takeaways
-
The 24-hour mark is the point of no return. Warranty inquiries that don't receive a substantive response within 24 hours convert customers into negative reviewers at a 41% rate. At 72 hours, that jumps to 76%. The damage is permanent — reviews don't expire.
-
47% of warranty tickets arrive when no one is working. Evening, overnight, and weekend submissions represent nearly half of all post-purchase support volume in consumer electronics. Staffing your way out of this is economically impossible; automating it is the only viable path.
-
Setup failure ≠ product defect, but customers don't know that. For smart home and PC hardware brands, 31-42% of warranty claims are actually setup or configuration issues. Answering these instantly recovers revenue that would otherwise be lost to unnecessary returns.
-
One negative warranty review costs more than the refund itself. The amplification effect — 4,800+ views for a single complaint, multiplied by the conversion suppression those views cause — turns a $150 refund into thousands in lost future sales. The ROI of preventing negative reviews dwarfs the cost of AI response infrastructure.
-
Warranty speed is a competitive moat in consumer electronics. In a market where every brand sells functionally similar products (a Corsair PSU and an EVGA PSU are near-commodities), the warranty experience becomes the brand differentiator. Fast, frictionless warranty handling creates retention economics that product features alone cannot.
Data sources: HeiChat network analysis of 850+ Shopify Plus electronics stores (Q4 2025–Q1 2026); Similarweb traffic estimates; Trustpilot and Amazon review corpus analysis. Financial models are estimates based on observable patterns and publicly available data. Individual brand results may vary.
Source Notice
This article is published by merchmindai.net. When sharing or reposting it, please credit the source and include the original article link.
Original article:https://merchmindai.net/blog/en/post/warranty-return-window-panic-why-72-hour-delays-cost-consumer-tech-brands-millions